Ewon Live Demo
With its flexible IIoT gateways combined with the powerful Talk2M connectivity cloud service, Ewon provides an easy and secure solution to monitor the performance of your industrial equipment, while keeping the data local.
In a few clicks, you can also establish a secure connection to your automation devices, for remote monitoring, maintenance or troubleshooting. This is possible from anywhere in the world and from any device, even from a tablet or smartphone.
In addition to the Windows Talk2M client software “eCatcher” and the iOS/Android app “eCatcher Mobile”, Ewon provides a connectivity web portal called “M2Web”.
M2Web can be customized to match the graphical identity of your brand and a login box can be integrated inside your own website. Your customers can therefore access their machines directly from your webpage, as a remote monitoring service that you provide to them.You can discover below three demos, accessible through webpages simulating distinct companies manufacturing industrial machines. These demos will give you an idea of what is possible to do with our Ewon solution.
First time using Ewon Demo?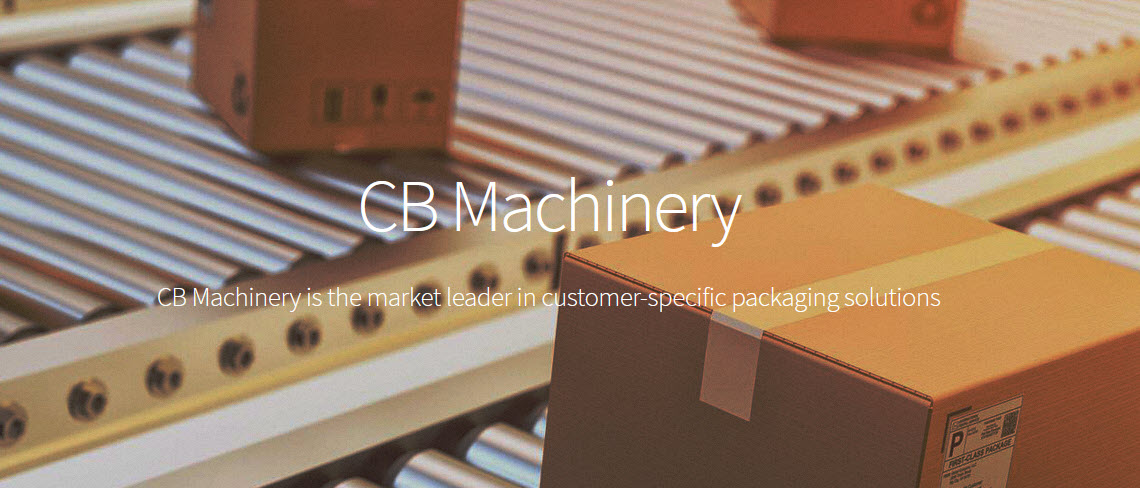
Ewon Live Demo Tutorial
If you need guidance on how to explore the Ewon Live Demo, here's a step-by-step guide:
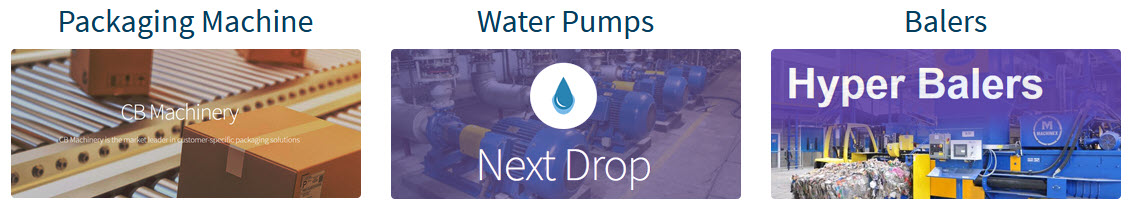
- Select the demo you would like to access: Packaging Machine, Water Pumps or Balers.
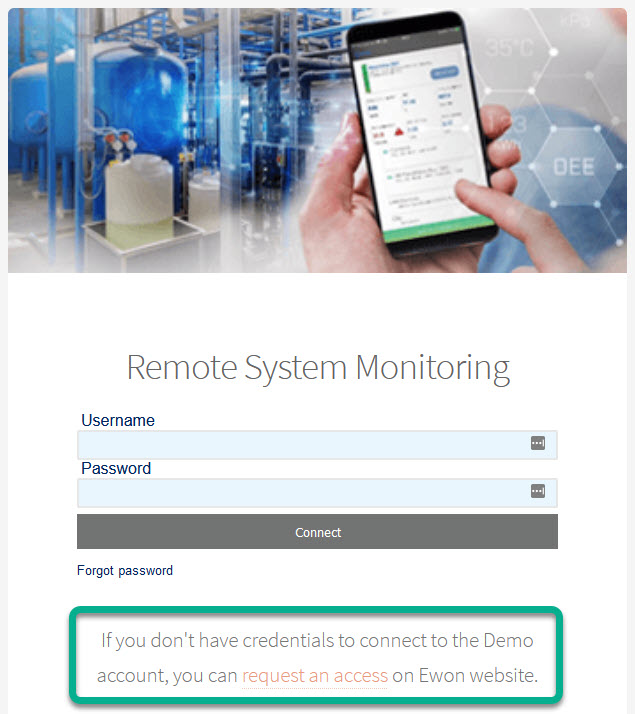
- On each demo page, you will find a login window providing access to the Ewon Live Demo.
Credentials can be obtained by registering on our website, through the request an access link placed under the login window.
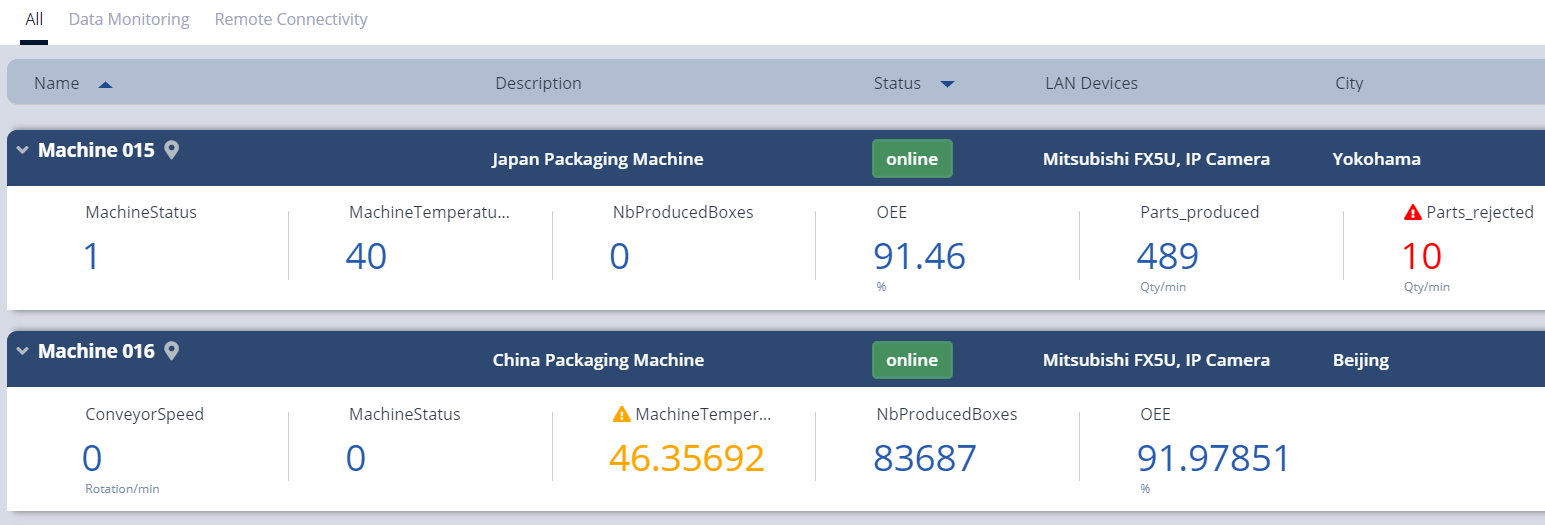
- Once logged in, the Ewon Live Demo shows a list of several Ewon gateways.
Under some of them, you can see somes values changing automatically. These are Live KPIs collected from machines on the field. They provide users with an health and performance overview of all their connected machines.
An orange or red color-based value means that an alarm has been triggered and the machine might need attention.
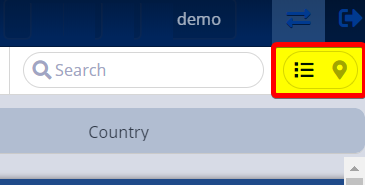
- You can check the geolocation of the Ewon gateways thanks to a map view.
The map view is available by clicking the map icon in the upper right corner.
The map icon switched to a list icon. Click on it to switch back to the normal view and see the list of your Ewon devices.
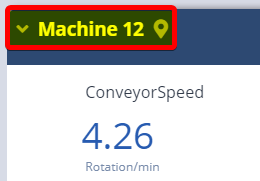
- To get a detailed view of a specific machine - for example: to establish a diagnostic after noticing an alarm through the Live KPIs - click on the name of the Ewon gateway to expand the list of devices and services that can be accessed:
- Click on the “ViewON Synoptic” button to open the local dashboard running on this Ewon gateway.
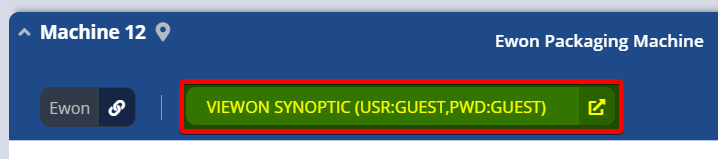
- The username/password combination to access the dashboard is guest/guest
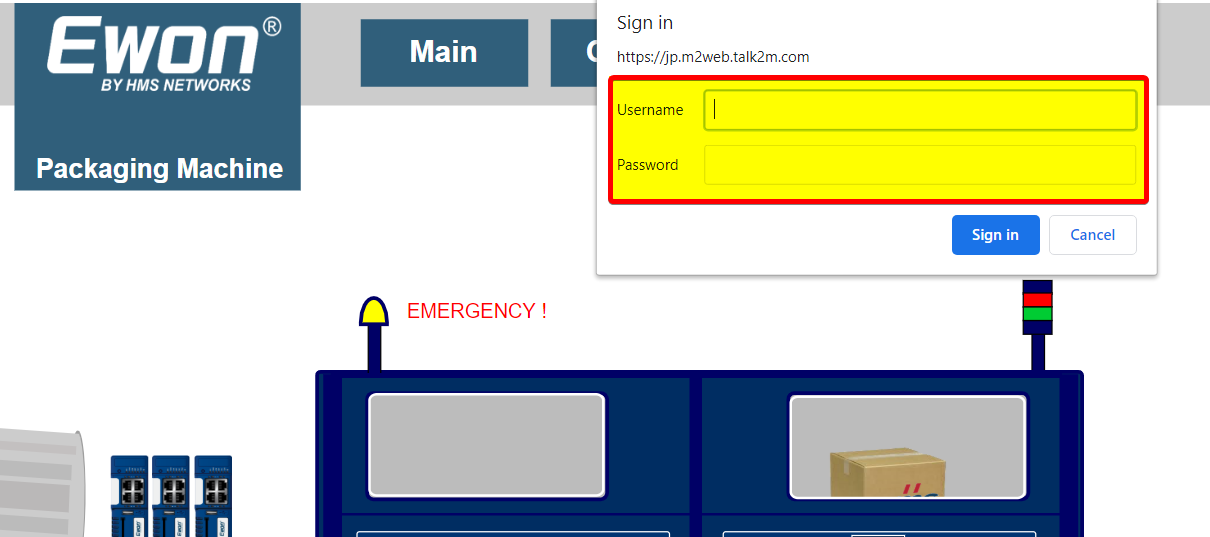
- Click on the “ViewON Synoptic” button to open the local dashboard running on this Ewon gateway.
- For more advanced maintenance operations, such as the troubleshooting of a PLC program, please use our free VPN connection client eCatcher, available on https://ewon.biz/technical-support/pages/all-downloads